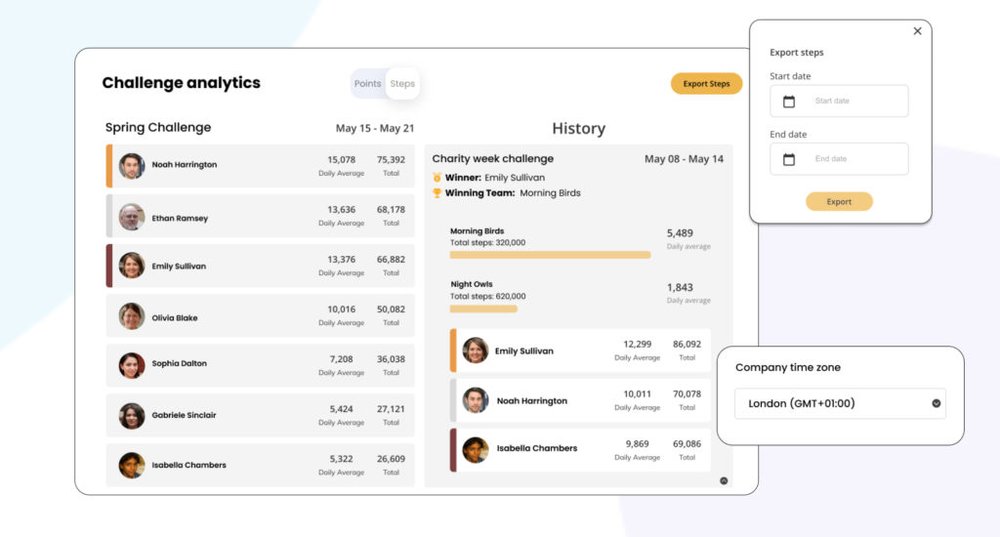
Challenge analytics is a powerful tool that can help you track your team’s progress, view previous challenges history, and understand your engagement better.
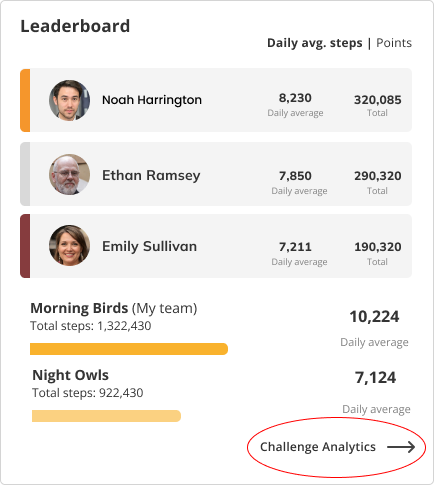
To use challenge analytics, simply login to your Reaction Club admin dashboard and select “challenge analytics” under the leaderboard.
As you enter the analytics scree you will see this:
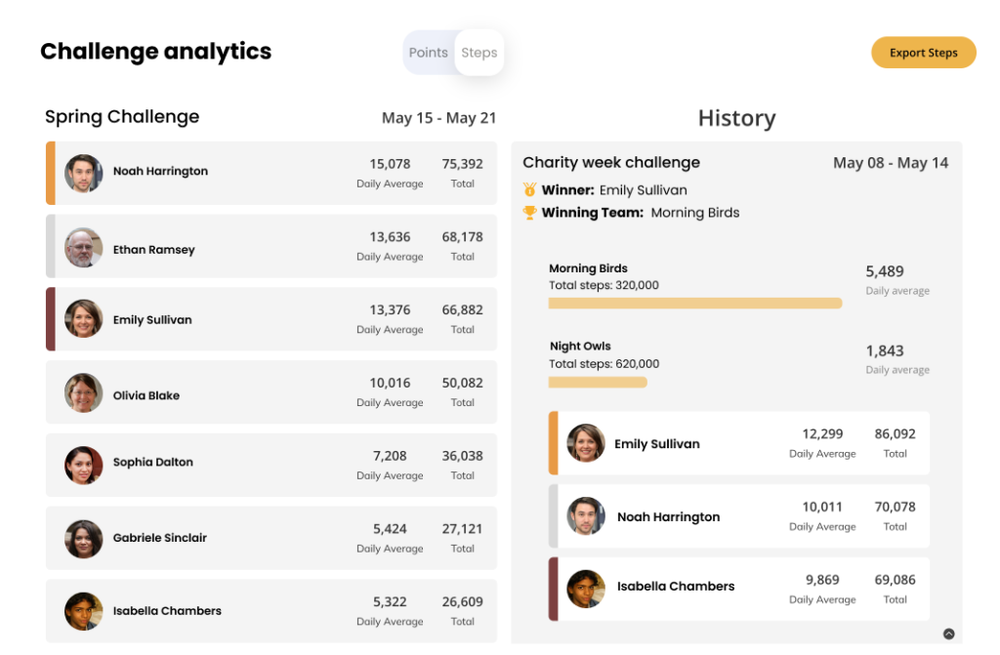
The left column of the challenge analytics view shows the current challenge leaderboard with total steps and daily average steps. The right column shows the history of previous challenges, including winning teams.
The yellow bar indicates which team had the highest daily average steps. We measure team competitions by daily average steps because it makes it easier to compare teams with different amounts of participants.
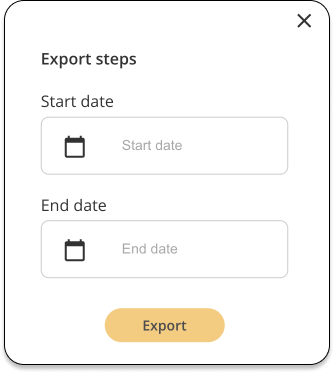
To export the step data based on your preferred time segment, click “export steps” and then select the time range. You can export data for the current challenge, previous challenges, or all challenges.
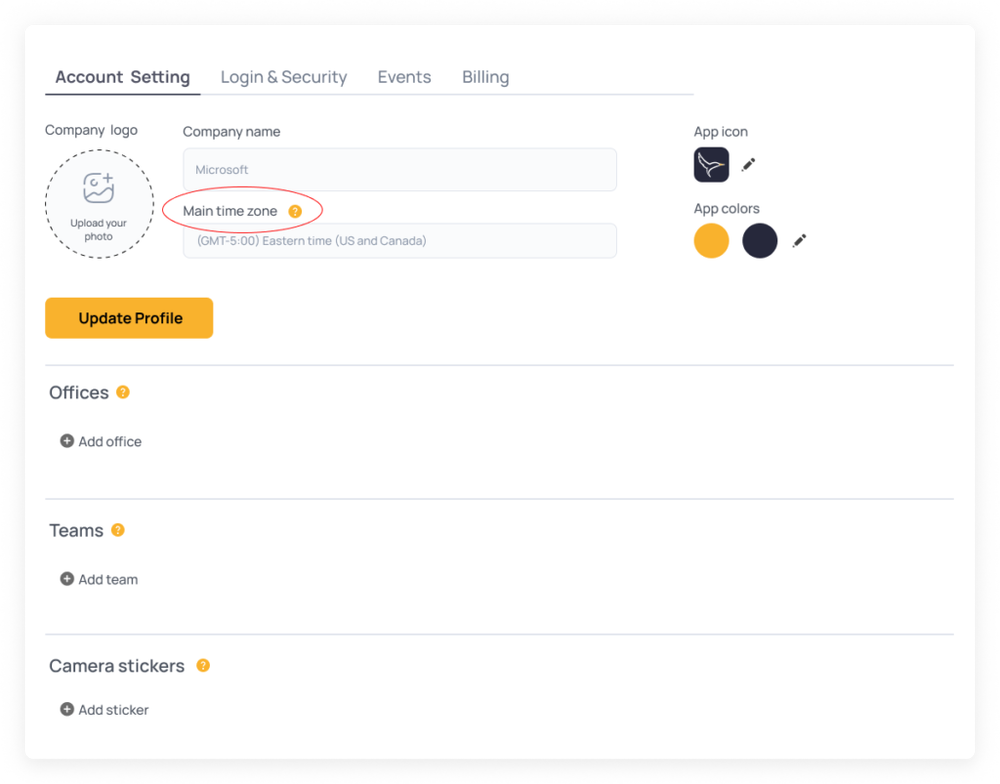
Your challenge will start and end at midnight based on your company’s time zone. To adjust your time zone, visit the settings tab and adjust the time zone.
Challenge analytics can help you increase engagement by giving your team a way to track their progress and see how they are doing compared to others. This can help motivate them to stay active and participate in the challenge.
